Monitor Mikrotik routers using Prometheus
To begin with, a few words about why it is necessary to monitor routers. A router, like any other device, has hardware resources that can become depleted. For example, the browser may become slower in opening pages or videos may take longer to load. This can be caused by either the internet service provider or the router. It’s possible that too many devices are connected to the router, causing it to slow down, or someone may be downloading excessively in parallel - all of this can be the reason for the slowdown.
So that’s why I decided to monitor my Mikrotik router in the realtime.
The concept
I have Mikrotik waP R that can use a SIM card to connect to a cellular network and provide Wi-Fi.

The general monitoring scheme looks like this:

Mikrotik
To monitor Mikrotik with Prometheus, you need to use a special exporter that converts Mikrotik’s SNMP metrics into a format that can be read by Prometheus. By default, SNMP is not enabled on Mikrotik, so you will need to enable it first with the following command:
[admin@MikroTik] /snmp
[admin@MikroTik] /snmp>  set enabled yes
SNMP-exporter
SNMP-exporter is needed to convert metrics from SNMP format into a special format that Prometheus understands. It is installed quite simply:
wget https://github.com/prometheus/snmp_exporter/releases/download/v0.20.0/snmp_exporter-0.20.0.linux-armv7.tar.gz
tar xzf snmp_exporter-0.20.0.linux-armv7.tar.gz
The next step will be to create a systemd service that will automatically start on boot. To do this, create the following file:
sudo vi /etc/systemd/system/snmp_exporter.service
With the following contents:
[Unit]
Description=SNMP Exporter
After=network-online.target

[Service]
User=pi
Restart=on-failure
ExecStart=/usr/local/bin/snmp_exporter --config.file='<path to>/snmp_exporter-0.20.0.linux-armv7/snmp.yml'

[Install]
WantedBy=multi-user.target
Next, you need to copy snmp_exporter:
sudo cp ./snmp_exporter-0.20.0.linux-armv7/snmp_exporter /usr/local/bin/snmp_exporter
And start the service:
sudo systemctl enable snmp_exporter
sudo systemctl start snmp_exporter
Check the status using the command below:
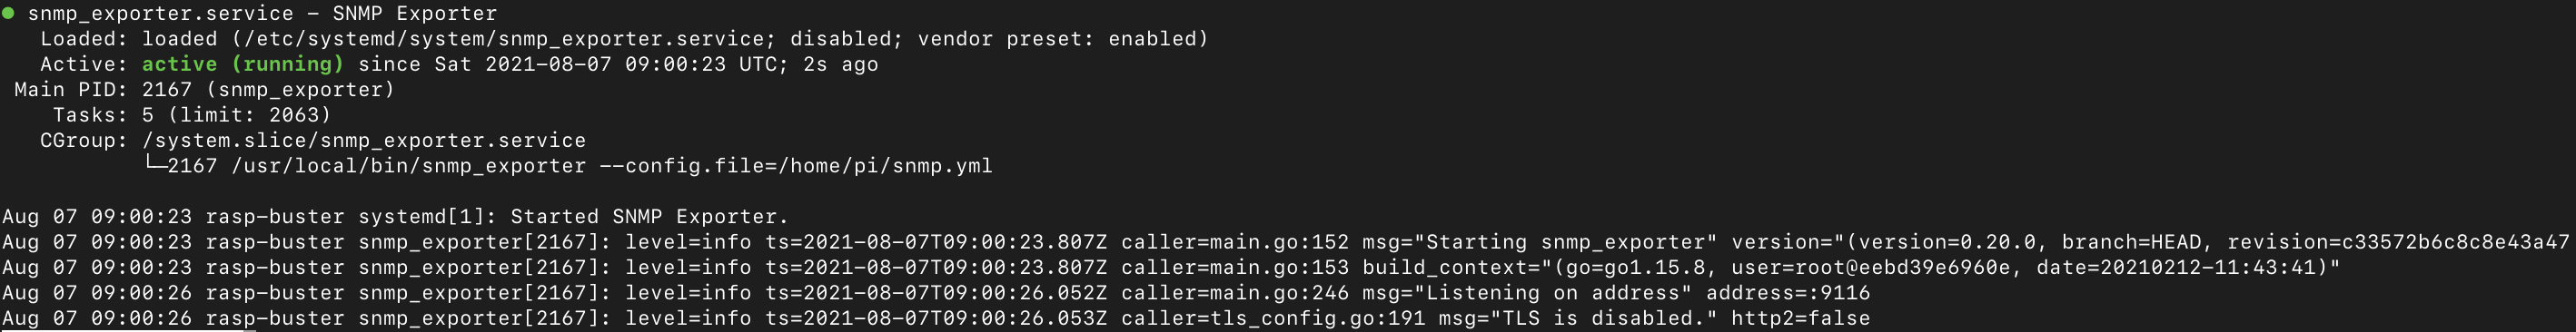
sudo systemctl status snmp_exporter
If the service started successfully, the output will be as follows:
Prometheus
All metrics will be stored in Prometheus, a special database for storing metrics that can be run locally or in the cloud.
I won’t go into detail on how to configure and start Prometheus, as there are comprehensive instructions available.
For now, it’s enough to configure the connection to the exporter, which is done through the main config file, prometheus.yaml.
  - job_name: mikrotik
    static_configs:
      - targets:
        - 192.168.1.1  # SNMP device.
    metrics_path: /snmp
    params:
      module: [mikrotik]
    relabel_configs:
      - source_labels: [__address__]
        target_label: __param_target
      - source_labels: [__param_target]
        target_label: instance
      - target_label: __address__
        replacement: raspberrypi.local:9116
Grafana
You can use pre-configured dashboards and instantly import them into Grafana.
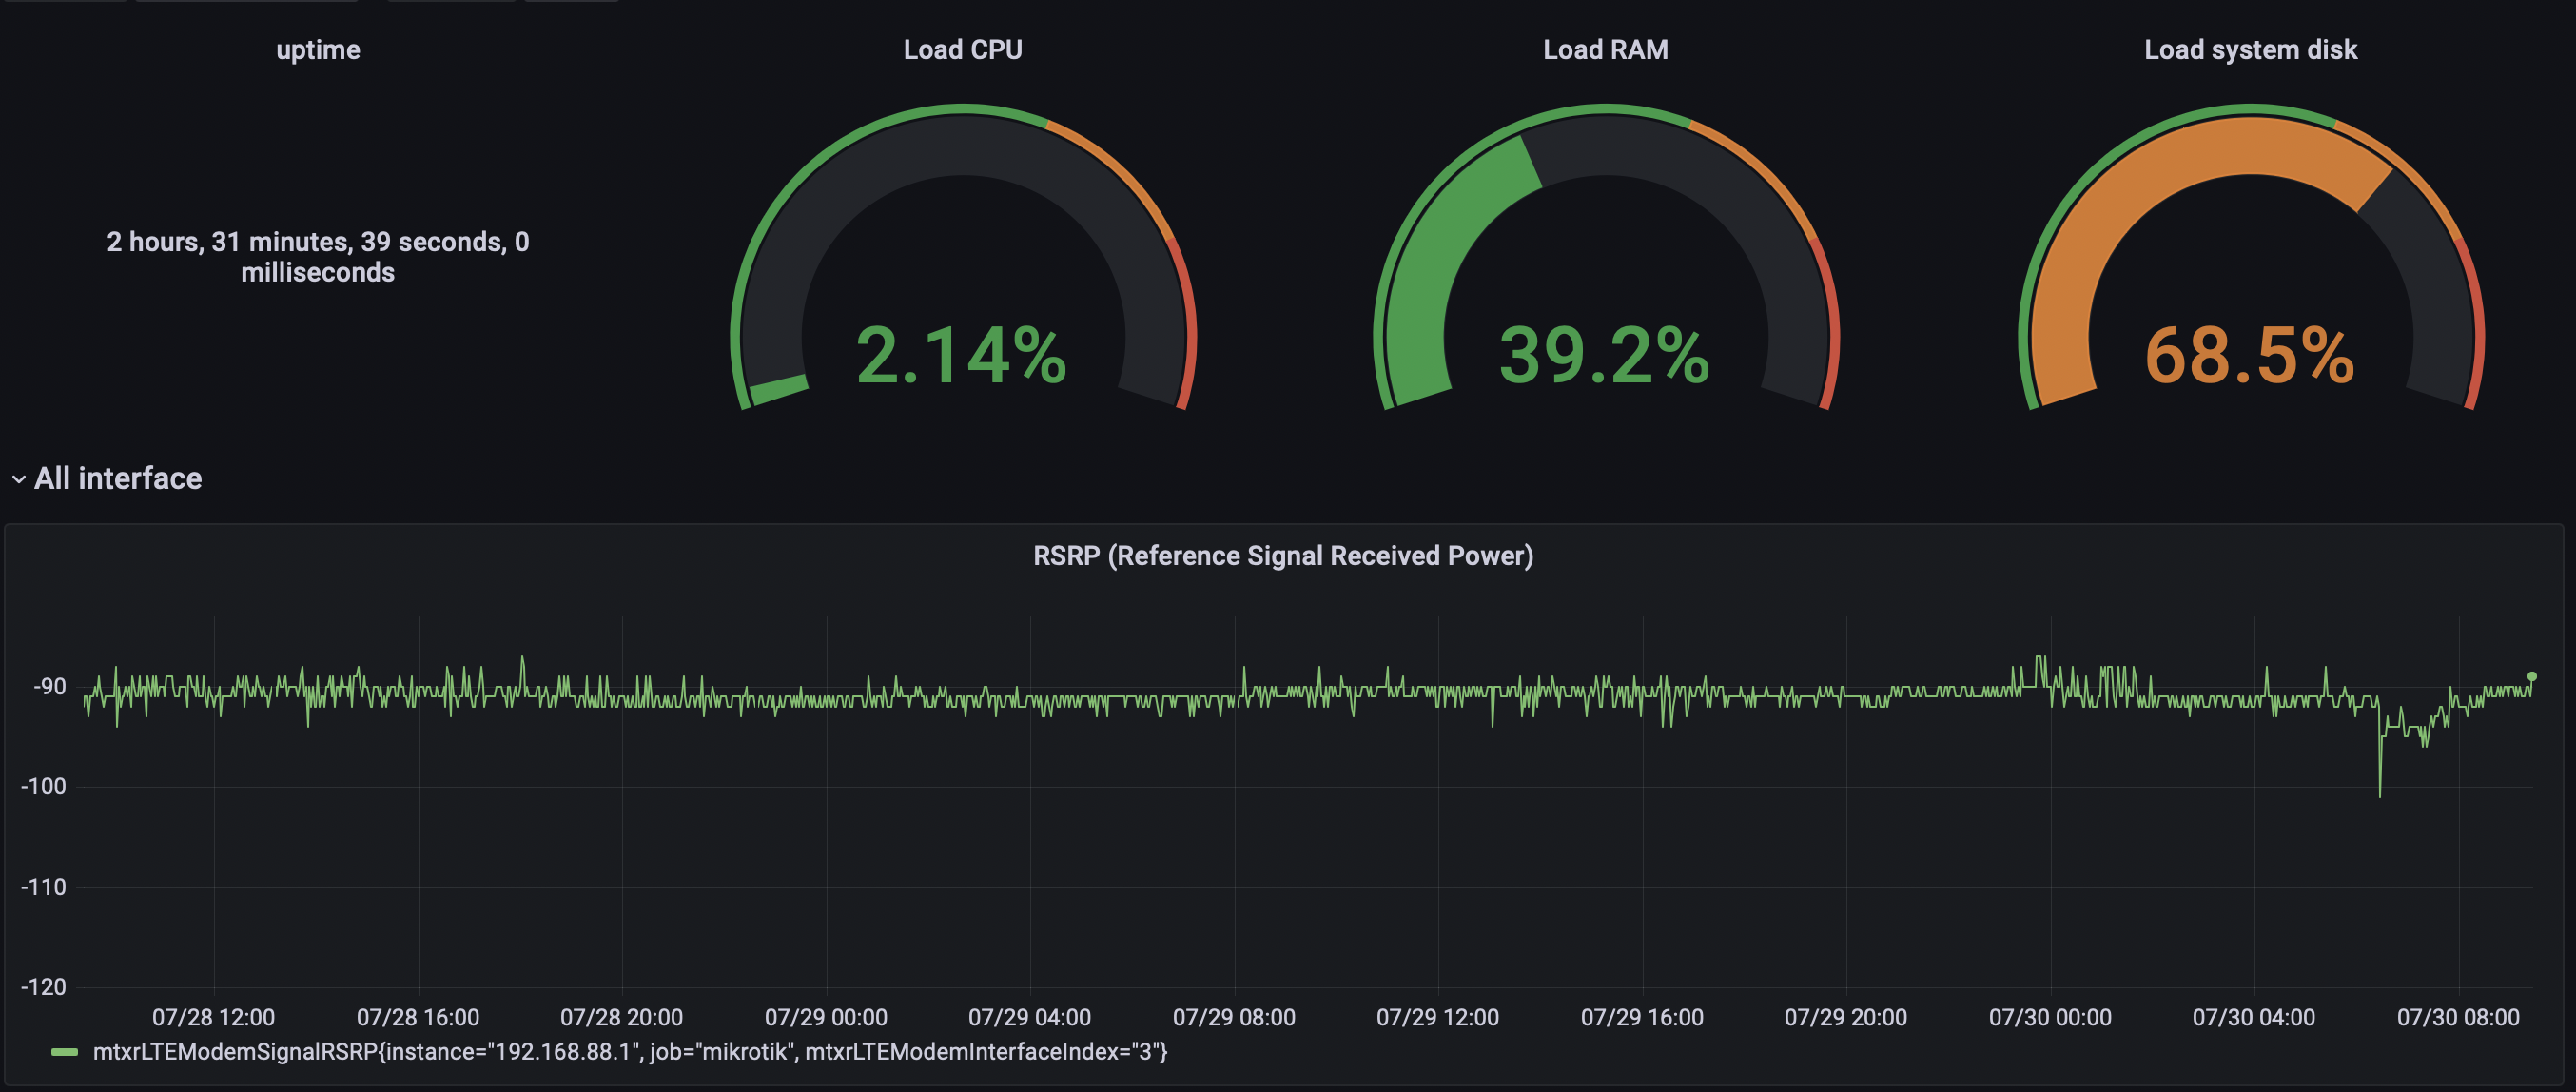
However each device is different and most of these dashboards don’t work for my device model. For Mikrotik waP R I manually selected the following parameters:
- Uptime -
sysUpTime{instance='$instance'}/100 - Load CPU -
avg(hrProcessorLoad{instance='$instance'}) - Load RAM -
(hrStorageUsed{hrStorageIndex='65536',instance='$instance'} * 100 )/(hrStorageSize{hrStorageIndex='65536',instance='$instance'}) - Load system disk -
(hrStorageUsed{hrStorageIndex='131072',instance='$instance'} * 100 )/(hrStorageSize{hrStorageIndex='131072',instance='$instance'}) - In/Out bit/sec -
irate(ifHCInOctets{job='mikrotik',ifName=~'$Interface',instance='$instance'}[20s])*8 - RSRP (Reference Signal Received Power) level of TLE signal -
mtxrLTEModemSignalRSRP
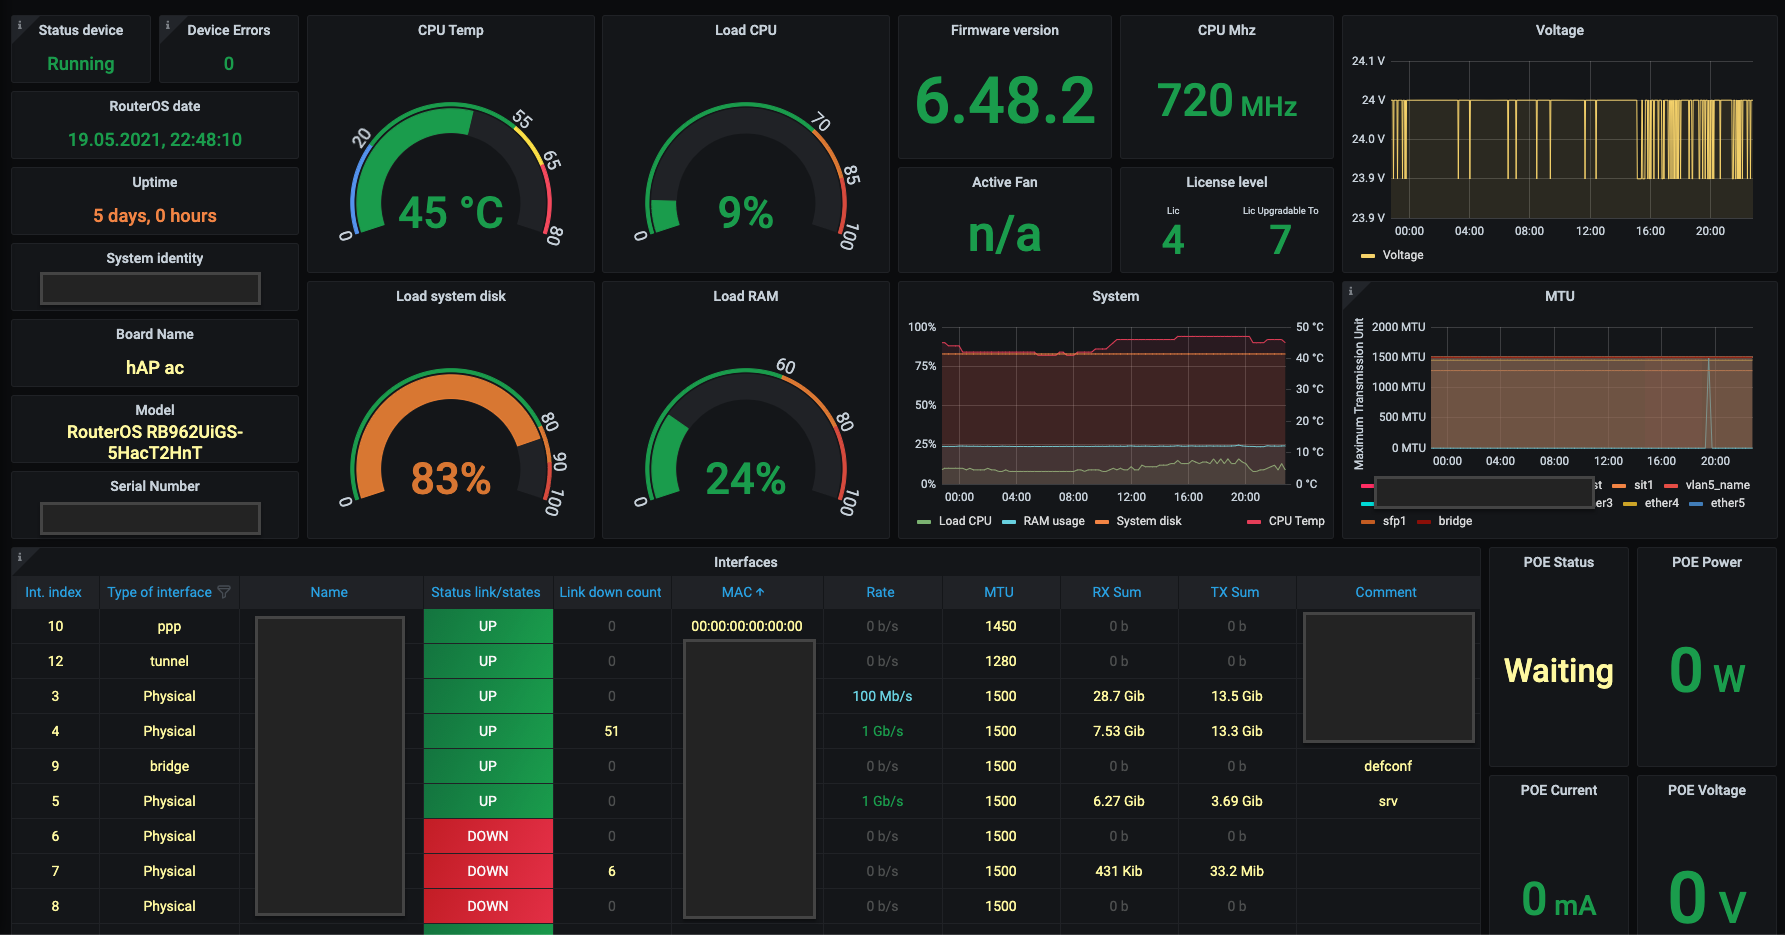
And added them to Grafana panels:
It is possible to add any other custom metrics using SNMP. Firstly you need to find their oid (SNMP identifier) using the command below:
[admin@MikroTik] /interface lte print oid
Then add oid into snmp.yaml:
pi@rasp-buster:~ $ grep 1.3.6.1.4.1.14988.1.1.16.1.1.4 snmp.yml -B 1
  - name: mtxrLTEModemSignalRSRP
    oid: 1.3.6.1.4.1.14988.1.1.16.1.1.4
Once added mtxrLTEModemSignalRSRP metric should be available in Prometheus and Grafana.